|
These
pages only briefly outline the main features and purpose of Data
Manager. To visit the Data Manager website, which includes a
detailed overview of the package, technical support, news of
version up-dates and demo downloads, please click on the following
link:
www.data-manager.co.uk
|
 What does Data Manager do?
|
|
Sample and record unlimited data
|
Configurable security levels
|
|
Multiple driver protocols
|
Daily event logs
|
|
Real time / historical data
analysis
|
Drawing editor
|
|
Charts, each with up-to 32
traces
|
ODBC Interface
|
|
Export of selected data in CSV
format
|
Logger history reporting
|
|
Alarm detection and
annunciation
|
Printing capabilities
|
|
Current PLC Drivers
|
|
FGH Standard Protocol
|
Omron SysMac Protocol
|
|
Modbus RTU Protocol
|
Mitsubishi FX series PLCs
|
|
West Protocol
|
AB SLC500 Protocol
|
|
ANSI X3 Protocol
|
Sartorius SBI Protocol
|
|
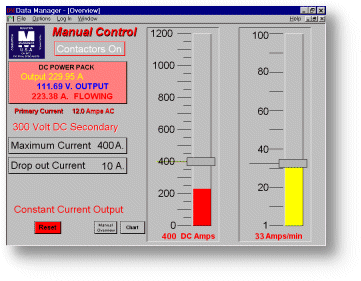
Data Logging
|
Tags
or points being sampled or recorded by Data Manager can be
integrated into Data View for historical or real time display. Pan
and zoom functions are available for high-resolution analysis, and
a data box giving historical or real time values can be displayed.
Any chart can be selected and loaded as the default chart.
Unlimited charts can be configured and stored to hard disk.
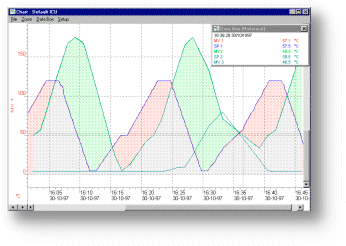
Unlimited
"pens" can be used, and the axis can be labelled using
variable fonts and scales. A unique fill between traces function
displays trends, and an auto ranging grid display can be
integrated into the chart. |
|
|
The Annunciator
|
The
Annunciator is a configurable and flexible annunciation
panel. The various alarm options are for conditions that may
require immediate attention from an operator. When the alarm
condition becomes true, the annunciation panel will pop up
on the screen, flash, sound and alarm and even send a
warning to a pager or mobile phone. All conditions, alarms
and errors are recorded in the event log for future
reference. |
|
|
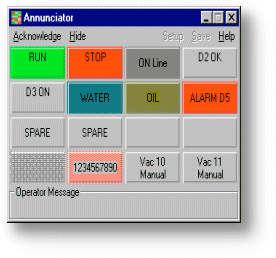
The annunciator panel
configured for various alarming conditions.
|
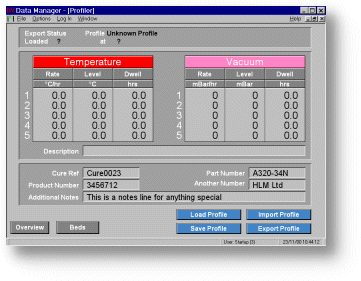
Data Draw
|
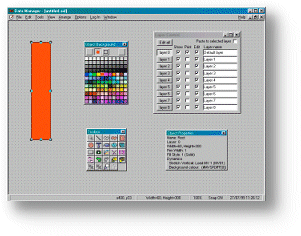
A drawing
package capable of being integrated into Data Manager to
give dynamic objects and real time data display. The toolbox
allows selection of lines, squares/rectangles,
circles/ellipses, polylines/polygons, text/tags,
times/dates, buttons, bitmaps and embedded charts. The
objects drawn can be static/dynamic, filled/unfilled,
solid/patterned, have line widths/no line widths and
line/fill/text colours applied. Cut/copy/paste functions are
also supported, as are
grouping/ungrouping/resizing/moving/zooming properties.
Custom colours can be generated from the color box, and an
object properties box shows all the settings of a particular
selected object. Layer control, if enabled, allows objects
to be placed on different layers. These layers can be shown
or hidden, depending on configurable conditions. The user
can completely customise the screens they are creating for
their system by applying dynamic properties to the objects
placed onto the screen.
Data View
enables the user to completely customise their screen, and
apply dynamic properties to objects from tag values read
from a remote device. |
|
|
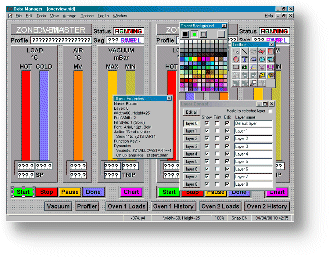
Run Time Examples
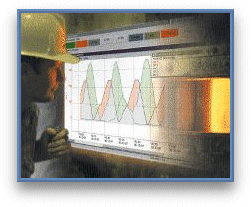
The following
screenshots are taken from customer's actual working SCADA systems, designed
and engineered by FGH. All of the systems utilise software that was customised
to the user's specifications.
To download a
full working demo version of this software package from the Data Manager
website, please click here!!
|